
Capitol COG
Key Facts
| Title |
Capitol COG 2022 5-year |
Error |
Connecticut 2022 5-year |
Error |
|---|---|---|---|---|
|
Total Population
|
977,165
|
+/-
0
|
3,611,317
|
+/-
0
|
|
Population Ages 0-17
|
200,946
|
+/-
2,101
|
742,877
|
+/-
4,362
|
|
% of Total Population, Ages 0-17
|
21%
|
+/-
0%
|
21%
|
+/-
0%
|
|
Population Ages 65+
|
167,285
|
+/-
2,619
|
629,108
|
+/-
4,901
|
|
% of Total Population, Ages 65+
|
17%
|
+/-
0%
|
17%
|
+/-
0%
|
|
Population Ages 65+
|
167,285
|
+/-
2,619
|
629,108
|
+/-
4,901
|
|
% of Total Population, Ages 65+
|
17%
|
+/-
0%
|
17%
|
+/-
0%
|
|
Population Female
|
499,705
|
+/-
44
|
1,842,121
|
+/-
389
|
|
% of Total Population, Female
|
51%
|
+/-
0%
|
51%
|
+/-
0%
|
| Title |
Capitol COG 2022 5-year |
Error |
Connecticut 2022 5-year |
Error |
|---|---|---|---|---|
|
Latino Population
|
174,513
|
+/-
0
|
627,408
|
+/-
0
|
|
% of Total Population, Latino
|
18%
|
+/-
0%
|
17%
|
+/-
0%
|
|
White Non-Hispanic Population
|
593,343
|
+/-
1,386
|
2,308,644
|
+/-
2,840
|
|
% of Total Population, White Non-Hispanic
|
61%
|
+/-
0%
|
64%
|
+/-
0%
|
|
Black Non-Hispanic Population
|
114,765
|
+/-
1,398
|
355,970
|
+/-
2,699
|
|
% of Total Population, Black Non-Hispanic
|
12%
|
+/-
0%
|
10%
|
+/-
0%
|
|
Other Race Non-Hispanic Population
|
94,544
|
+/-
2,199
|
319,295
|
+/-
4,544
|
|
% of Total Population, Other Race Non-Hispanic
|
10%
|
+/-
0%
|
9%
|
+/-
0%
|
| Title |
Capitol COG 2022 5-year |
Error |
Connecticut 2022 5-year |
Error |
|---|---|---|---|---|
|
Foreign-born Population
|
143,765
|
+/-
3,590
|
542,964
|
+/-
7,449
|
|
% of Total Population, Foreign-born
|
15%
|
+/-
0%
|
15%
|
+/-
0%
|
| Title |
Capitol COG 2022 5-year |
Error |
Connecticut 2022 5-year |
Error |
|---|---|---|---|---|
|
Total Households
|
386,549
|
+/-
1,438
|
1,409,807
|
+/-
3,257
|
|
Owner-Occupied Households
|
252,141
|
+/-
2,407
|
932,588
|
+/-
6,341
|
|
Homeownership Rate
|
65%
|
+/-
1%
|
66%
|
+/-
0%
|
|
Cost-Burdened Households
|
123,029
|
+/-
2,962
|
480,042
|
+/-
5,742
|
|
% of Households, Cost-Burdened
|
33%
|
+/-
1%
|
35%
|
+/-
0%
|
|
Households with a car
|
349,785
|
+/-
3,573
|
1,289,318
|
+/-
7,778
|
|
% of Households, with a car
|
90%
|
+/-
1%
|
91%
|
+/-
0%
|
| Title |
Capitol COG 2022 5-year |
Error |
Connecticut 2022 5-year |
Error |
|---|---|---|---|---|
|
Population Ages 25+
|
675,246
|
+/-
83
|
2,520,790
|
+/-
424
|
|
Ages 25+ without a high school diploma
|
60,675
|
+/-
2,218
|
220,076
|
+/-
4,349
|
|
% of Population Ages 25+, without a high school diploma
|
9%
|
+/-
0%
|
9%
|
+/-
0%
|
|
Ages 25+ with a Bachelor's degree or more
|
277,549
|
+/-
3,750
|
1,043,226
|
+/-
7,904
|
|
% of Population Ages 25+, with a Bachelor's degree or more
|
41%
|
+/-
1%
|
41%
|
+/-
0%
|
| Title |
Capitol COG 2022 5-year |
Error |
Connecticut 2022 5-year |
Error |
|---|---|---|---|---|
|
Median Household Income
|
88,190
|
+/-
1,229
|
90,213
|
+/-
730
|
| Title |
Capitol COG 2022 5-year |
Error |
Connecticut 2022 5-year |
Error |
|---|---|---|---|---|
|
Total Population, Poverty Status Determined
|
942,162
|
+/-
7,825
|
3,507,563
|
+/-
16,647
|
|
Population in Poverty
|
101,370
|
+/-
3,983
|
355,692
|
+/-
8,118
|
|
Poverty Rate
|
11%
|
+/-
0%
|
10%
|
+/-
0%
|
|
Population Low-Income
|
214,596
|
+/-
5,973
|
786,615
|
+/-
12,356
|
|
Low-Income Rate
|
23%
|
+/-
1%
|
22%
|
+/-
0%
|
| Title |
Capitol COG 2022 5-year |
Error |
Connecticut 2022 5-year |
Error |
|---|---|---|---|---|
|
Population Ages 0-17, Poverty Status Determined
|
198,566
|
+/-
4,184
|
733,553
|
+/-
8,266
|
|
Population Ages 0-17 In Poverty
|
27,821
|
+/-
1,756
|
98,183
|
+/-
3,343
|
|
Population Ages 0-17, Poverty Rate
|
14%
|
+/-
1%
|
13%
|
+/-
0%
|
|
Population Ages 0-17 Low-Income
|
57,625
|
+/-
2,473
|
210,923
|
+/-
4,939
|
|
Population Ages 0-17, Low-Income Rate
|
29%
|
+/-
1%
|
29%
|
+/-
1%
|
| Title |
Capitol COG 2022 5-year |
Error |
Connecticut 2022 5-year |
Error |
|---|---|---|---|---|
|
Population Ages 65+, Poverty Status Determined
|
161,750
|
+/-
3,209
|
609,617
|
+/-
6,032
|
|
Population Ages 65+ In Poverty
|
14,105
|
+/-
994
|
48,446
|
+/-
1,765
|
|
Population Ages 65+ Poverty Rate
|
9%
|
+/-
1%
|
8%
|
+/-
0%
|
|
Population Ages 65+ Low-Income
|
36,835
|
+/-
1,614
|
132,552
|
+/-
3,098
|
|
Population Ages 65+, Low-Income Rate
|
23%
|
+/-
1%
|
22%
|
+/-
0%
|
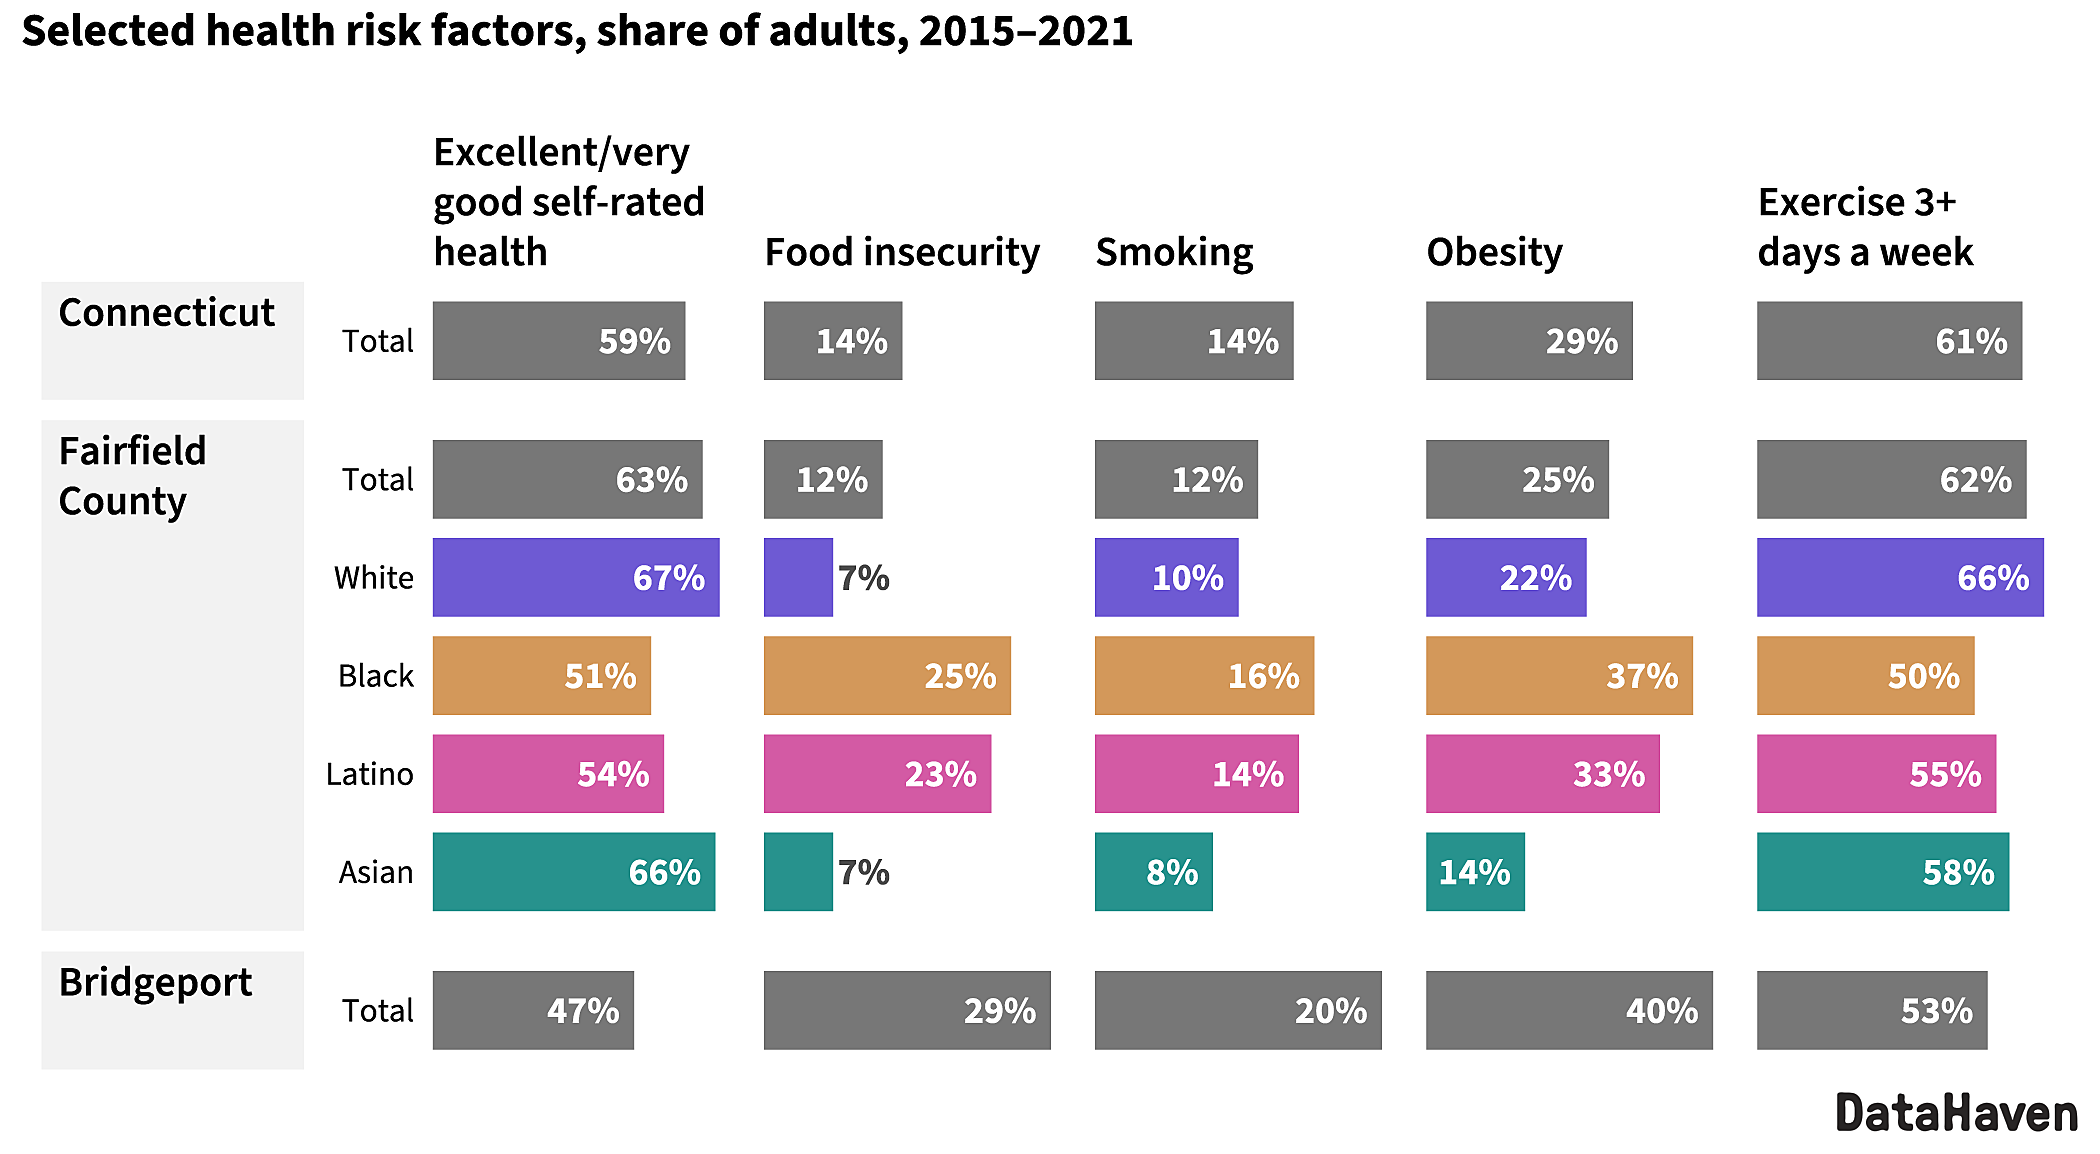
Source
Community Well-being data are from the 2021 DataHaven Community Wellbeing Survey. See definitions below for more information. All other data are from the US Census Bureau ACS 5-year estimate. The ACS surveys a sample of households on a rolling monthly basis; survey data are aggregated and averaged into 1 and 5-year period estimates. The Census Bureau considers the 5-year estimates to be the most accurate and recommends using 5-year estimates for town-level data.